How the dashboard at cloud.assistant-ui.com is laid out, how ranges, filters and time work on every page, who may change what, and the demo project.
The dashboard at cloud.assistant-ui.com reads everything the SDK and your server sent to a project and turns it into pages. Every page covers one date range you pick, every filter is part of the URL so a view can be sent as a link, and every mention of a thread, run, model or user is a link to its page. This page is the map; each page of the dashboard has its own page in this section.
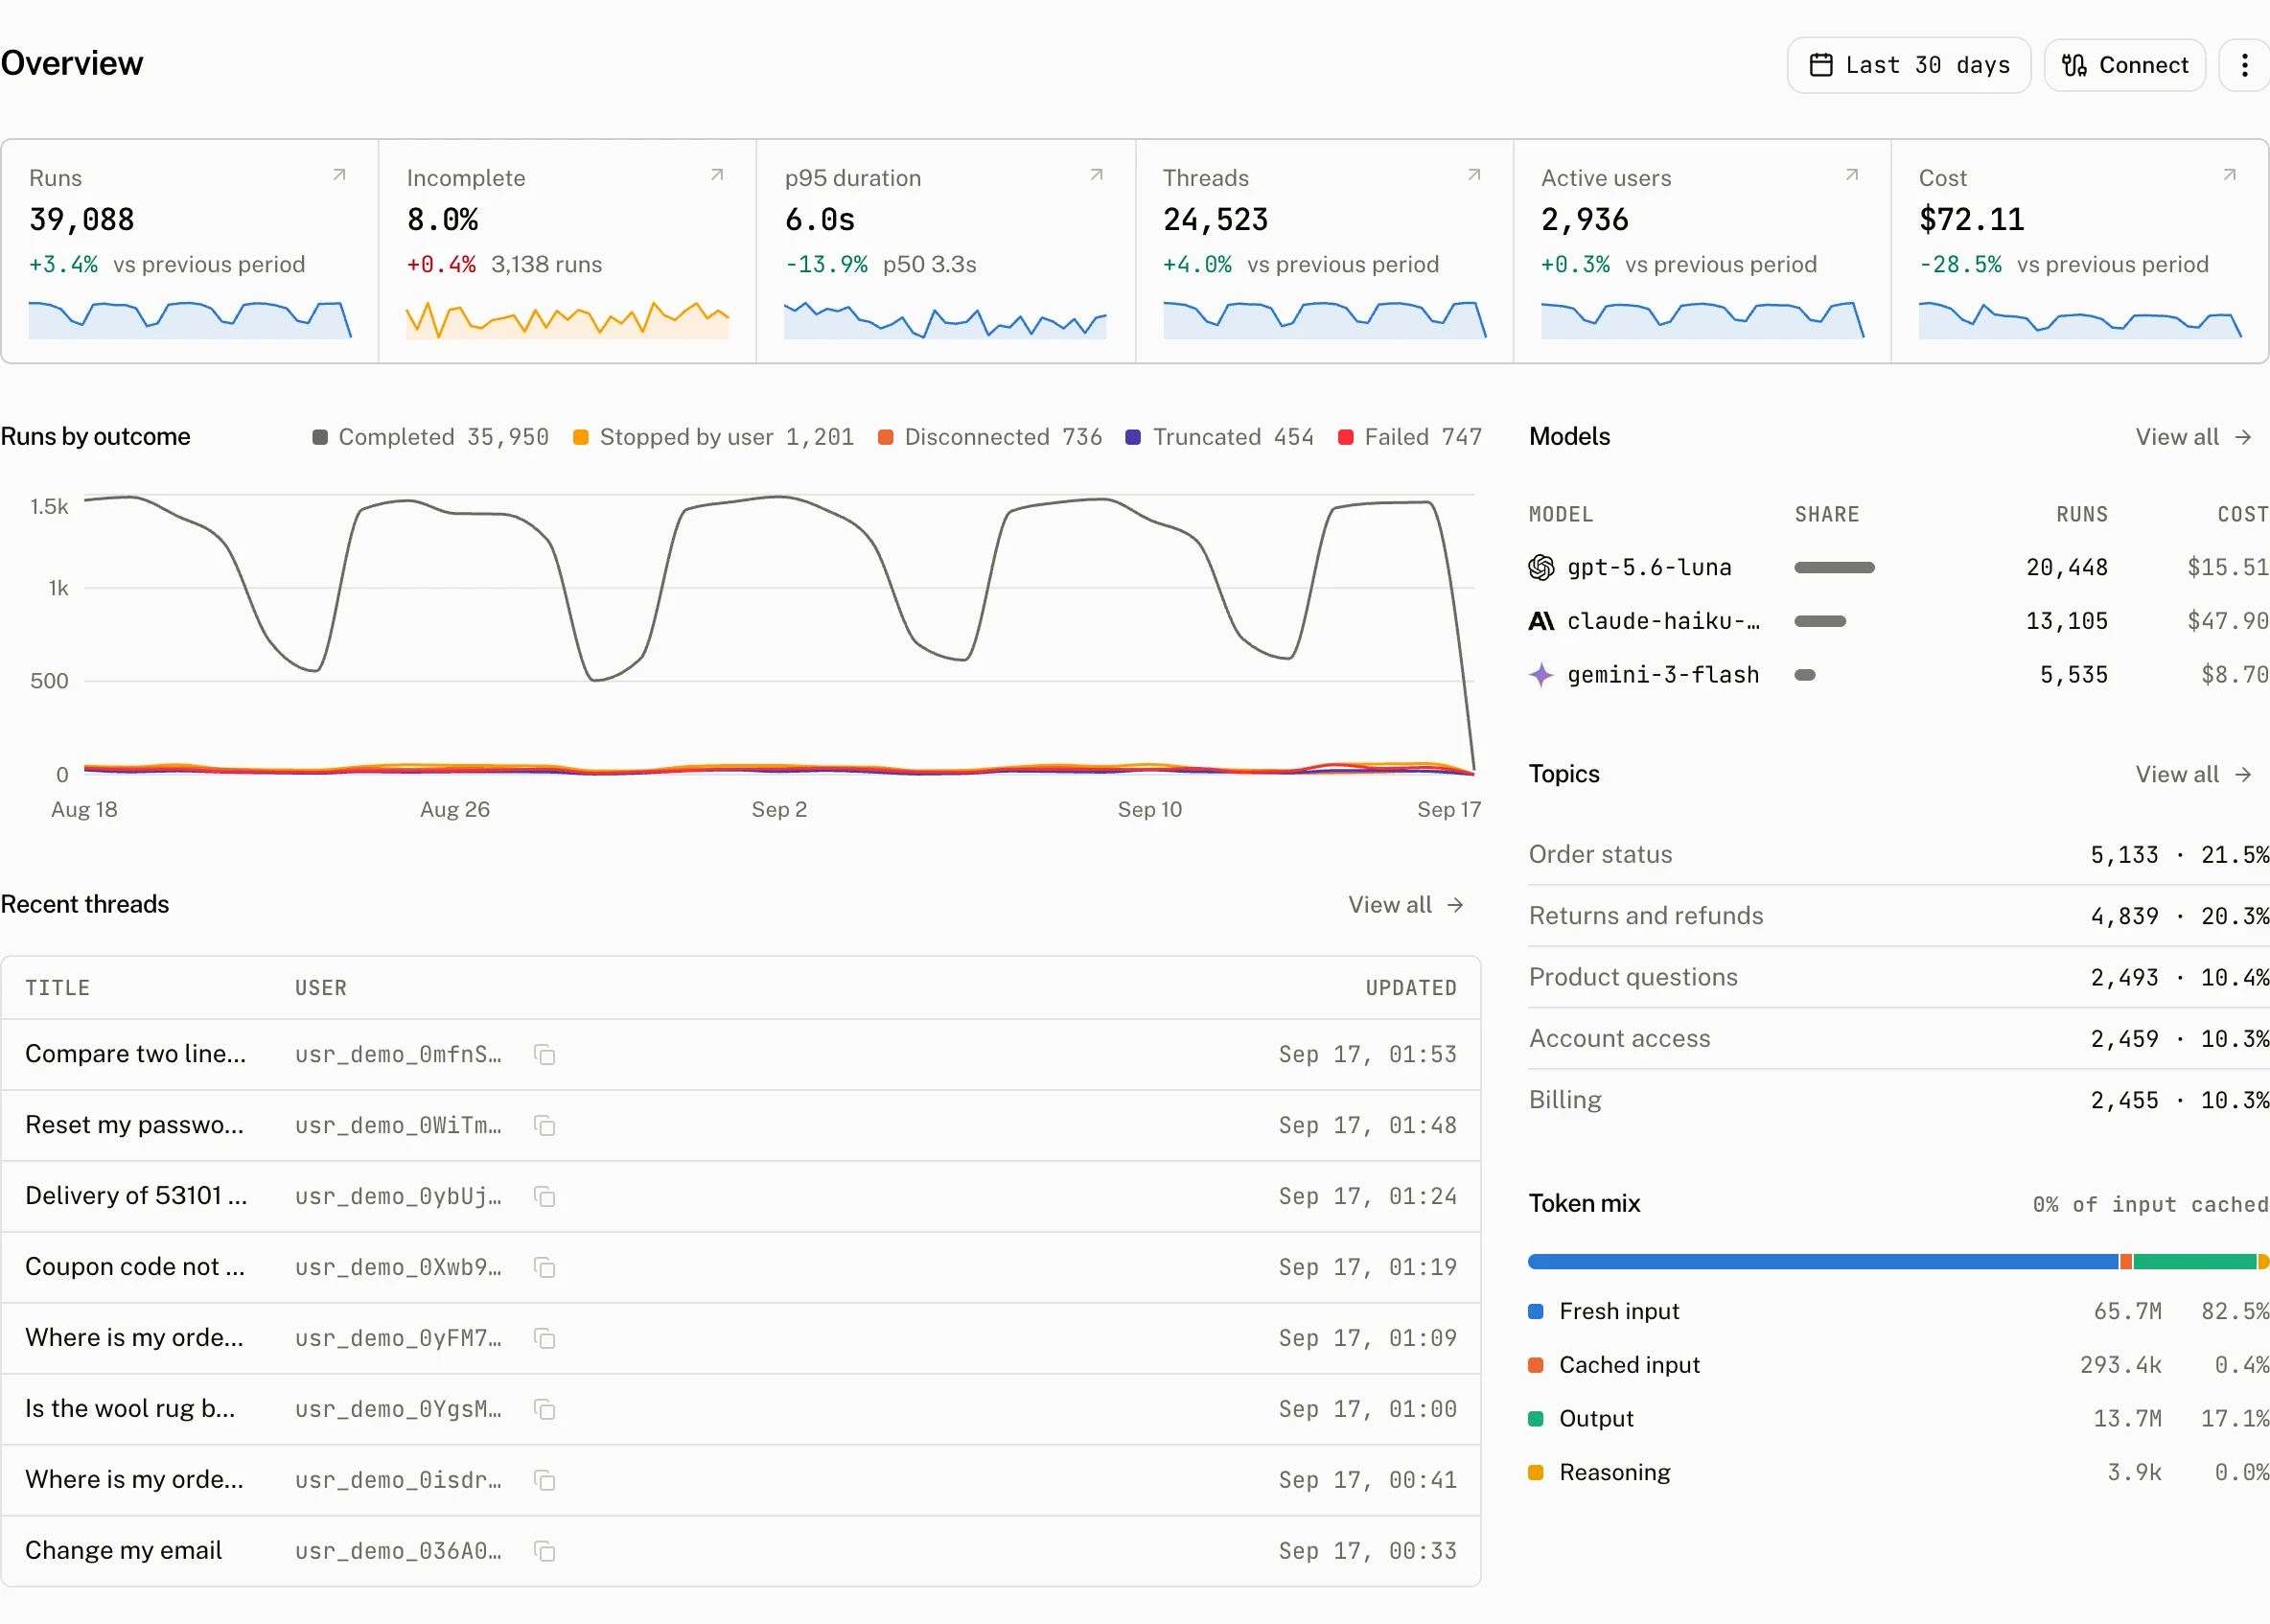
The pages
The sidebar lists places, grouped by the question they answer.
| Group | Page | The question it answers |
|---|---|---|
| Overview | How is the assistant doing over this range? | |
| Observe | Threads | What did people talk about, and how did each conversation go? |
| Observe | Runs | How did each response go, and what did it cost? |
| Observe | Models | What does each model cost and how does it behave? |
| Observe | Users | Who uses it, and do they come back? |
| Observe | Engagement | What do people do around the answers? |
| Observe | Intelligence | What do they ask, and where does the assistant fall short? |
| Build | Harnesses, Assistants, LLM providers | What the cloud runs for you, on which keys |
| Project | Settings, Billing and Usage | How the project is configured and billed |
The Build group carries a Preview badge: its pages are in preview and may change without notice. The Billing and Usage pages exist only on the hosted service.
The header holds the project switcher as the first crumb (it opens the Overview), the path to the current page, the id of the entity you are looking at with a copy button, and the jump box: ⌘K opens a run, a thread or a user by id, or goes to a page. Outbound links, the account page, the theme and sign out are in the menu under your name.
Ranges and buckets
Every page reads one date range from the URL, chosen with the range picker in the page header. Tiles summarise the range and show the change against the previous range of the same length; charts draw the range in buckets the span decides: days beyond three days, then hours, minutes and down to one second for a range of seconds. A range is written as UTC days (from=2026-09-01) or as instants to the second (from=2026-09-08T04:30:00Z). Clicking a bar of a page's volume strip narrows the list to that bucket.
The Overview, Runs and Models pages default to the last 30 days, Intelligence to the last 28, and Billing to the current calendar month. The plan's active users are always counted per UTC calendar month, whatever range a page shows.
Filters, sorting and paging
Every list page filters through one bar placed under its tiles: search, then facets from the most used to the least, then the range facets under More, then Clear on the right edge. Facets are URL state and show counts for the range, so a filtered list is a link you can send. Threads hides archived threads, and its facet counts are the number of rows a facet opens. Tables page at 25, 50 or 100 rows and default to 50; a column header that sorts is a link. Exports of the current filters and range are on the Threads, Runs and Users pages on plans that include them; see Exports.
Time
Figures are computed in UTC: a day is a UTC day and a month is a UTC month. Times are displayed in your browser's zone, read from cookies the dashboard sets when it loads, and a relative time ("2 minutes ago") is relative to your clock. A figure that disagrees between the dashboard and your own logs is usually a zone difference.
Roles
A project belongs to an organization, and your role in the organization decides what you may change. Membership is managed on the account page at accounts.assistant-ui.com.
| Owners and admins only | Every member |
|---|---|
| Allowed origins; data retention, including cancelling a pending change; every alert rule action; the audit log; billing and the Stripe portal | Reading every page; API keys; auth rules and anonymous access; LLM providers, assistants and harnesses; thread titles, intelligence, evaluators and model prices; scores written from the dashboard; intelligence requests; the project name, slug, icon and trace link |
Every write, whichever role made it, is recorded in the audit log with the fields that changed and never with a secret.
The demo project
cloud.assistant-ui.com/demo is Northwind Support, a retailer's synthetic support assistant. It is open without an account and read only, on the Startup plan, so Intelligence, evaluators and exports are visible, and it gains an hour of conversations every hour. Every screenshot in this book was taken there. Nothing in it is a real customer, and no model is ever called for it: its analysis rows are generated with the data.